Solve the problem.The graph below shows the total sales of houses in a town from 2000 to 2005. The graph also shows the sale of houses in the summer , S, and in the other times of the year, Y. Estimate The number of houses sold at other times in 2005.
A. 20
B. 13
C. 33
D. 9
Answer: B
Mathematics
You might also like to view...
Subtract.23 - 8.88
A. 14.12 B. 31.88 C. 13.62 D. 14.22
Mathematics
Find any intercepts. Then graph the linear equation.-3x - 6y = 12
A. x-int: -4; y-int: 2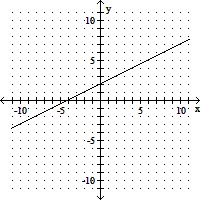
B. x-int: -4; y-int: -2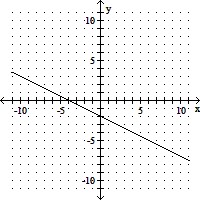
C. x-int: 4; y-int: -2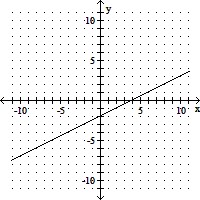
D. x-int: 4; y-int: 2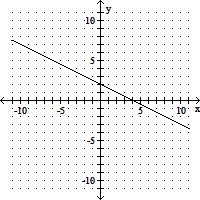
Mathematics
Solve the equation.3(6 + 3x) = 
A. {3}
B. {9}
C. 
D. {-3}
Mathematics
Solve the absolute-value inequality.|g - 1| < 4
A. {g -3 < x < 5}, or (-3, 5)
B. {g -3 < x < 5}, or (-3, -5)
C. ?
D. {g 3 < g < 5}, or (3, 5)
Mathematics