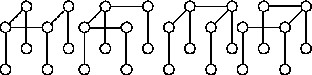
Find all the spanning trees in the graph.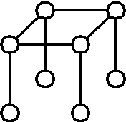
What will be an ideal response?
You might also like to view...
The table below shows the value V, in dollars, of a certain rare coin t years since 1950. t 0 30 45 54 60 V 30 402 654 1840 2151? A: Use exponential regression to model V as a function of t. Round your answer to two decimal places.B: Plot the exponential model along with the data points.C: According to the exponential model, what is the value of the coin in 2015? Round your answer to the nearest cent.
What will be an ideal response?
Solve.Find the area of the skating rink. Round to the nearest tenth.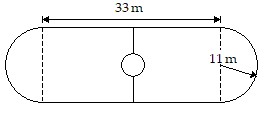
A. 742.9 sq m B. 1485.9 sq m C. 1122.9 sq m D. 1105.9 sq m
Solve the problem.The function f(t) = -0.12t2 + 0.53t + 30.8 models the U.S. population in millions, ages 65 and older, where t represents years after 1990. The function g(t) = 0.55t2 + 11.89t + 105.3 models the total yearly cost of Medicare in billions of dollars, where t represents years after 1990. What does the function  represent? Find
  (15).
(15).
A. Cost per person in thousands of dollars. $0.16 thousand B. Cost per person in thousands of dollars. $0.03 thousand C. Cost per person in thousands of dollars. $34.67 thousand D. Cost per person in thousands of dollars. $8.64 thousand
Simplify the expression by combining like terms, if possible.-3y + 7 - 5 + 1 + y - 3
A. -4y + 1 B. -4y C. -2y D. -2y - 1