These are the cost and revenue curves associated with a firm. 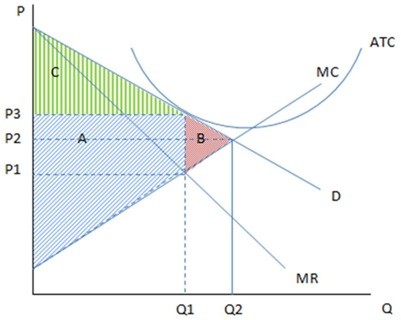 If the firm in the given graph were to produce Q1 and charge P3, the area C would represent:
A. deadweight loss.
B. consumer surplus.
C. producer surplus.
D. profits.
Answer: B
You might also like to view...
Refer to Game Matrix III. Which of the following is a property of this game?
Game Matrix III
The following questions refer to the game matrix below. Each firm has a choice of advertising, Ads, or not advertising, No ad. The profits each gets depend upon which it chooses.
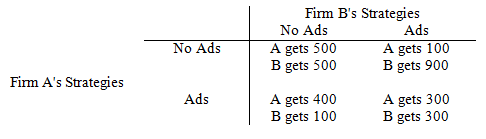
a. Both firms have dominant strategies.
b. There is no pure strategy Nash equilibrium.
c. There is a Nash equilibrium and it is Pareto optimal.
d. There is a Nash equilibrium and it is not Pareto optimal.
In the ________, each firm treats the output of its competitor as fixed and then decides how much to produce
A) Cournot model B) model of monopolistic competition C) Stackelberg model D) kinked-demand model E) none of the above
According to John Taylor, during the period 2002-early 2006 the Fed set its federal funds rate target _____________ the rate that would have existed had the Fed set its target using the Taylor rule
A) below B) above C) equal to D) sometimes below and sometimes above
The four somewhat overlapping theories of how the entrepreneur is able to earn a profit are: (1) ___________; (2) ___________; (3) ___________; and (4) ____________.
Fill in the blank(s) with the appropriate word(s).