Exhibit 7-13 Cost curves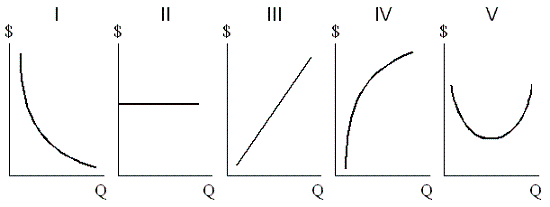
In Exhibit 7-13, TFC is shown by the graph labeled:
A. I.
B. II.
C. III.
D. IV.
Answer: B
You might also like to view...
Total planned expenditures for domestically produced goods and services consist of
A) consumer spending, business spending, government spending, and net export spending. B) consumer spending, business spending, government spending, and import spending. C) consumer spending, business spending, and net export spending only D) government spending, business spending, and import spending only.
Refer to Figure 2-4. A movement from ________ is the result of negative technological change in plastic production
A) V to X B) Z to Y C) X to W D) W to Z
Suppose that minimum efficient scale is approximately 20 percent of maximum potential market demand. In that case,
a. there will be approximately 20 firms in the market b. we should expect to see a few large competitors c. we should expect to see many small competitors d. we should expect a natural monopoly to emerge e. minimum efficient scale is too small for perfect competition to exist
Studies of the effects of the minimum wage typically find that a 10 percent increase in the minimum wage depresses teenage employment by about
a. 1 to 3 percent. b. 5 to 7 percent. c. 10 percent. d. None of the above is correct because studies show no decrease in teenage employment.