Find the area of the figure. Use 3.14 for ?. Round your answer to the nearest tenth.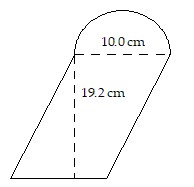
A. Not enough data
B. 270.5 cm2
C. 231.3 cm2
D. 223.4 cm2
Answer: C
You might also like to view...
Solve.Use the approximations ln 3 ? 1.099 and ln 4 ? 1.386 together with the properties of natural logarithms to calculate an approximation to ln 0.75.
A. -0.288 B. -0.287 C. 1.261 D. 0.793
Answer the question.In a graph that displays the annual percent increase in the price of grain, what does it mean if the graphs falls over a certain period?
A. Inflation has gone down B. The real cost of grain has gone down C. The rate at which the price is rising is decreasing D. The price of grain is decreasing
The polar equation of the graph is either r = a + b cos ? or r = a + b sin ?, a > 0, b > 0. Match the graph to one of the equations. 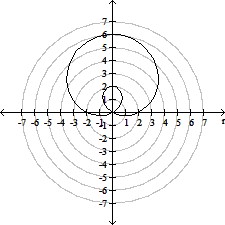
A. r = 4 + 2 cos ? B. r = 4 + 2 sin ? C. r = 2 + 4 sin ? D. r = 2 + 4 cos ?
Write the number in trigonometric form. Let 0° ? ? < 360°.4
A. 4(cos 90° + i sin 90°) B. 4(cos 0° + i sin 0°) C. 4(cos 270° + i sin 270°) D. 4(cos 180° + i sin 180°)