Solve the problem.In a Psychology class, the students were tested at the end of the course on a final exam. Then they were retested with an equivalent test at subsequent time intervals. Their average scores after t months are given in the table.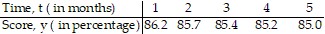 Using a graphing utility, fit a logarithmic function y = a + b ln x to the data. Using the function you found, estimate how long will it take for the test scores to fall below 84%. Express your answer to the nearest month.
A. 8 months
B. 10 months
C. 12 months
D. 20 months
Answer: D
Mathematics
You might also like to view...
Use the table of values of f to estimate the limit.Let f(x) =  , find
  f(x).
f(x).
A. 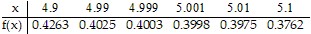 ; limit = 0.4
B. 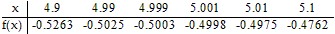 ; limit = -0.5
C. 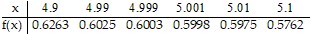 ; limit = 0.6
D. 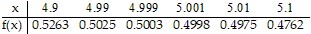 ; limit = 0.5
Mathematics
A feasible region and its vertices are shown. Find the specified maximum or minimum value of the given objective function. Maximum of K = 3x + y
A. 25 B. 39 C. 29 D. 7
Mathematics
For an election with 4 candidates (A, B, C, and D), we have the following preference schedule:
 Using the plurality-with-elimination method, the winner of the election is
A. A. B. B. C. C. D. D. E. none of these
Mathematics
Evaluate.85
A. 40 B. 390,625 C. 262,144 D. 32,768
Mathematics