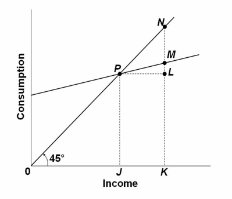
The graph above shows the relationship between consumption and income. Which of the following statements is correct?
A. The marginal propensity to consume in the economy shown is greater than 1
B. The marginal propensity to consume varies across income levels
C. The average propensity to consume at income level K is given by KM divided by KN
D. The marginal propensity to consume can be calculated by dividing LM by 0K
C. The average propensity to consume at income level K is given by KM divided by KN
You might also like to view...
Agricultural prices fell during each of these periods EXCEPT
A. 1865-1900. B. 1900-1919. C. 1929-1933. D. There is no exception. Agricultural prices fell in all these time periods.
A barter arrangement essentially means
A) swapping goods for cash. B) buying with an I.O.U. C) a credit deal. D) a cashless transaction.
If a surplus accumulates as the result of agricultural support prices, the government must buy it; otherwise the support price cannot be maintained
Indicate whether the statement is true or false
The central idea behind the Troubled Asset Relief Program was for the Treasury to sell mortgage-backed securities to interested investors, wait for prices to increase, and then buy these securities back for a profit.
Answer the following statement true (T) or false (F)