The figure below shows the production-possibility curves for Canada (AB) and the rest of the world (CD). The opportunity cost of producing one liter of maple syrup in Canada and in the rest of the world are ________ bushels and ________ bushels of corn, respectively.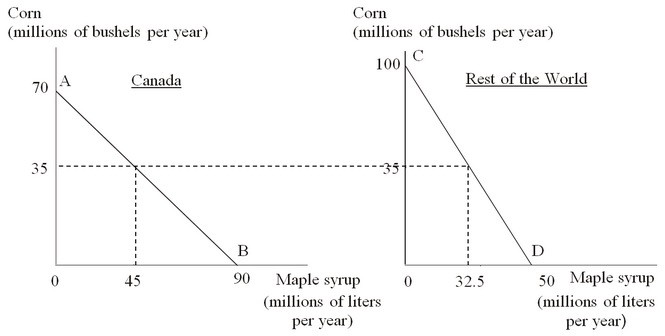
A. 7/9; 1/2
B. 9/7; two
C. 7/9; two
D. 9/7; 1/2
Answer: C
You might also like to view...
Which of the following statements is correct?
A. When marginal utility is positive, an increase in the quantity consumed will increase total utility. B. When marginal utility is zero, an increase in the quantity consumed will make total utility zero. C. When marginal utility is decreasing, an increase in the quantity consumed will decrease total utility. D. When marginal utility is positive, an increase in the quantity consumed will decrease total utility.
The Single European Act was expected to create economic benefits by reducing the costs and risks of currency market transactions
Indicate whether the statement is true or false
Refer to Scenario 3. The average variable cost of producing three units of output is:
A) $15. B) $25. C) $41.67 (approximate). D) $75.
As price rises, quantity supplied
A. rises. B. falls. C. remains the same.