Using a graph, show the effects of a negative externality. Where is the socially optimum point of output? How can it be achieved?
What will be an ideal response?
See the above figure. E is the equilibrium when people only take into consideration private costs, with output Q1 and price P1. When external costs (EC) are added to private costs, the optimal point is E*, with output Q* and price P*. That is, the social optimum with externalities is to produce less and charge a higher price than private costs alone indicates. If a tax is imposed that caused price to increase to P*, or output were restricted to Q*, the optimum could be achieved.
You might also like to view...
The MU/P equalization principle means consumers will spend their income (budget) so that the MU/P ratio of the goods consumed is
a. zero for each good b. higher for goods the consumer wants the most (highest marginal utility) c. maximized for the goods the consumer wants the most (highest marginal utility) d. higher than TU/P e. the same for each good
The business sector in the United States has the most influence on
a. primary education. b. on-the-job training. c. teacher training. d. higher education.
Which of the following statements sums up the arms race?

a. The dominant strategy for each nation was to spend less on arms.
b. Each country’s dominant strategy led to an inferior outcome for the world.
c. Self-interest drove each country into a cooperative game.
d. Each country’s dominant strategy led to a safer outcome for the world.
Figure 7-5
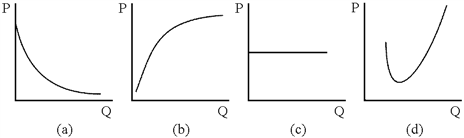
Which of the graphs in Figure 7-5 could be a firm's total fixed cost curve?
a.
(a)
b.
(b)
c.
(c)
d.
(d)