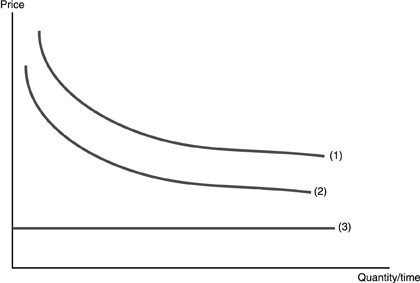
 Refer to the above figure. The above figure shows the cost structure of a firm producing an information product. Which curve represents average total cost?
A. Any of the 3 could be ATC.
B. Curve 1
C. Curve 2
D. Curve 3
Answer: B
Economics
You might also like to view...
When constructing a production possibility curve for an economy, which of the following is assumed to be constant?
a. The quantity of resources b. The government budget c. The quantity of goods produced d. The price level e. The money supply
Economics
Is wage discrimination more likely in competitive or monopolistic markets?
What will be an ideal response?
Economics
The Great Depression, in which real GDP fell and unemployment rose, can be characterized as a...
What will be an ideal response?
Economics
From 1979-2007, labor income for U.S. households became more evenly distributed.
Answer the following statement true (T) or false (F)
Economics