Use the following diagrams for the U.S. economy to answer the next question.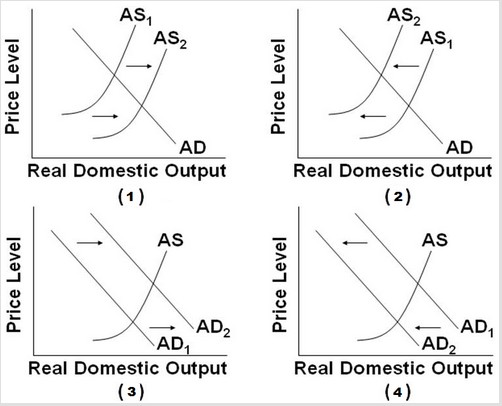 Which of the diagrams best portrays the effects of an increase in resource productivity?
A. Graph (1)
B. Graph (2)
C. Graph (3)
D. Graph (4)
Answer: A
You might also like to view...
Real GDP per person in rich countries, such as Germany, is sometimes more than 10 times that of poor countries like India
a. True b. False Indicate whether the statement is true or false
In a market economy, government intervention
a. will always improve market outcomes. b. reduces efficiency in the presence of externalities. c. may improve market outcomes in the presence of externalities. d. is necessary to control individual greed.
Stagflation refers to a situation in which the economy is experiencing:
A. high economic growth and high inflation. B. low economic growth and high inflation. C. high economic growth and low inflation. D. low economic growth and low inflation.
The monetary stimulus enacted in the fall of 2001 provides support for those economists who favor
A. stable money supply growth. B. activist monetary policy. C. rules-governed monetary policy. D. fixed rates of growth for the money supply.