Refer to Table 9-14. The percentage change in real average earnings from 1965 to 2010 equals
A) 2.0 percent. B) 19.7 percent. C) 24.6 percent. D) 80.3 percent.
C
You might also like to view...
According to the economic way of thinking, scarcity implies
A) money. B) competition. C) capitalism. D) chaos. E) all of the above.
Refer to the information provided in Table 6.4 below to answer the question(s) that follow. Table 6.4Number ofDonuts per DayTotal UtilityMarginal Utility180?2150?3200?4230?5?10Number ofBurritos per DayTotal UtilityMarginal Utility160?2108?3144?4168?5?12Refer to Table 6.4. Diminishing marginal utility sets in after the ________ donut per day.
A. first B. second C. third D. fourth
Explain the problems with exchange rate controls.
What will be an ideal response?
Refer to the diagrams, in which AD 1 and AS 1 are the "before" curves and AD 2 and AS 2 are the "after" curves. Other things equal, a decrease in resource prices is depicted by:
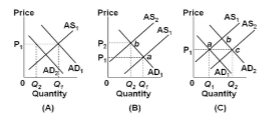
A. panel (A) only.
B. panel (B) only.
C. panel (C) only.
D. panels (B) and (C).