Solve the problem.The following data represents the average percent of possible sunshine for a certain city in Indiana. 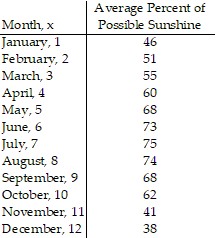 Draw a scatter diagram of the data for one period. Find the sinusoidal function of the form
 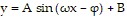 that fits the data. Draw the sinusoidal function on the scatter diagram. Use a graphing utility to find the sinusoidal function of best fit. Draw the sinusoidal function of best fit on the scatter diagram.
What will be an ideal response?
y = 15.99 sin (0.57x - 2.29) + 60.62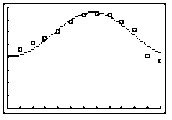
Mathematics
You might also like to view...
Decide whether or not the number is a zero of the polynomial.P(x) = -4x3 + x2 + 7x - 2; -3
A. No B. Yes
Mathematics
Simplify the ratio.2.25 to 0.5
A. 
B. 
C. 
D. 
Mathematics
Write an equation of the line through the given point with the given slope. Write the equation in slope-intercept form.(0, 4); m = - 
A. y = -  x + 4
x + 4
B. y = -  x - 4
x - 4
C. y = -  x + 4
x + 4
D. y = -  x +
x + 
Mathematics
Add.2 + (-9)
A. -11 B. 11 C. 7 D. -7
Mathematics