Using relevant diagrams, illustrate a two-country, two-commodity model in which one country has an absolute advantage in the production of both goods, but each has a comparative advantage in the production of only one good. Assume both countries have the same total amount of national labor to use in production in the country, and labor is the only factor of production.
What will be an ideal response?
POSSIBLE RESPONSE: The following figure shows the quantities of wheat and cotton that both Country A and Country B can produce in a year.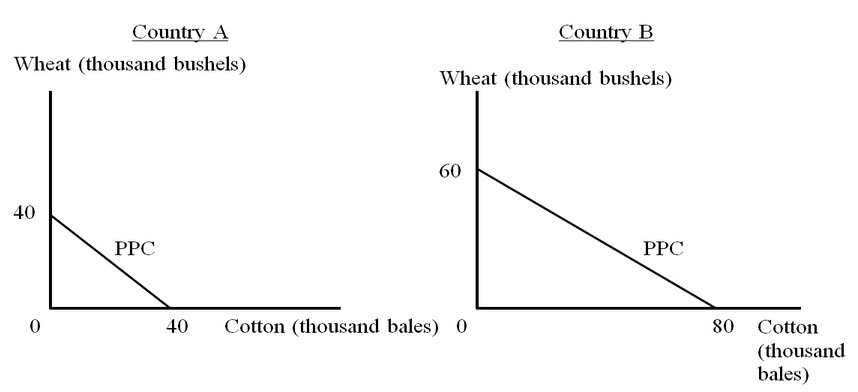
Assume countries A and B have the same national endowment of labor, and labor is the sole factor of production. From the figures, we can see that Country B has an absolute advantage in the production of both commodities, because, with the same amount of labor, Country B can produce more of each commodity (if each country were to devote all of its labor to producing only that product). However, the opportunity cost of producing wheat in Country A is 40/40=1C/W and that in Country B is 80/60 = (4/3) C/W. The opportunity cost of producing wheat is lower in Country A; hence Country A has a comparative advantage in the production of wheat. On the other hand, the opportunity cost of producing cotton in Country A is 40/40=1W/C and that in Country B is 60/80 = (¾) W/C. Therefore, Country B has a comparative advantage in the production of cotton.
You might also like to view...
How many and what fraction of the world's people live in advanced economies? In emerging market and developing economies?
What will be an ideal response?
Throughout the period from 1996 to 2010, U.S. Real GDP growth has been
a. constant. b. declining. c. steadily increasing. d. fluctuating.
Adjusting monetary growth based on previous changes in nominal GDP
A) is relatively easy for the Fed to undertake because the implementation lag is quitelong. B) could be destabilizing because of the uncertainty of the length of impact lags. C) is an effective policy because it allows the Fed to influence future macroeconomic performance. D) raises the price level proportionately.
The average per capita income in 2010 for low-income developing nations was:
A. $580 B. $2,100 C. $1,240 D. $4,600