This graph demonstrates the domestic demand and supply for a good, as well as a quota and the world price for that good.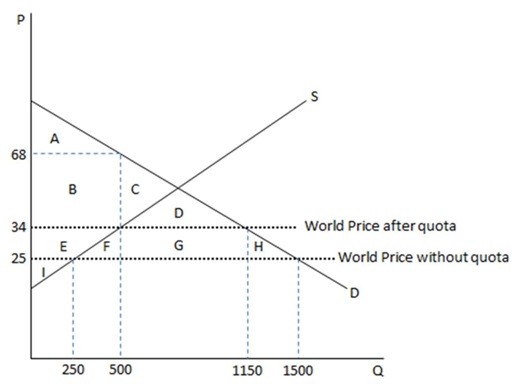 According to the graph shown, if the government restricts free trade, area G represents:
A. government tax revenues, which go to the domestic government.
B. quota rents, which go to foreign firms or governments.
C. quota rents, which go to domestic producers.
D. government tax revenues, which go to the foreign government.
Answer: B
You might also like to view...
In a graph with output in the Y axis and efficiency units of labor in the X axis, which of the following causes a rightward movement along the aggregate production function?
A) A decrease in the capital stock B) An increase in the total efficiency units of labor C) An improvement in technology D) A decrease in the productivity of workers
Suppose real GDP is $800 billion when the MPC is 0.80, and people decide to increase their saving by $30 billion. Before this change, the economy was in equilibrium with people intending to save $100 billion and producers intending to invest $100 billion. The new equilibrium level of real GDP is:
a. $600 billion. b. $650 billion. c. $680 billion. d. $730 billion. e. $800 billion.
Starting from long-run equilibrium, a large increase in government purchases will result in a(n) ________ gap in the short-run and ________ inflation and ________ output in the long-run.
A. expansionary; higher; potential B. recessionary; higher; potential C. recessionary; lower; lower D. expansionary; higher; higher
Differentiate between nominal and real GDP
What will be an ideal response?