Figure 10.4, shown below, presented data on 62 countries' inflation rates relative to the U.S. rate of inflation and the percent change in the exchange rate for the years 1980-2010. What was the relationship between these two variables?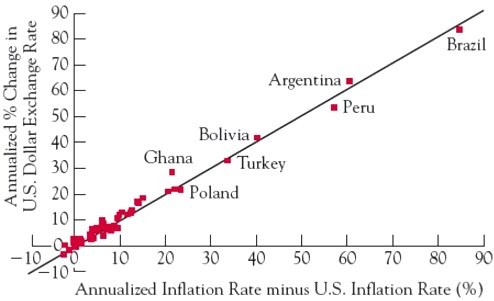
What will be an ideal response?
The data shows that countries with high rates of inflation relative to the U.S. also experienced currency depreciation relative to the dollar. While the data do not line up perfectly to reflect purchasing power parity, it does show that purchasing power parity goes a long way in explaining the behavior of exchange rates over a long period of time.
You might also like to view...
If nominal GDP exceeds real GDP for a specific year, then the GDP deflator must be
A) greater than 100. B) less than 100. C) equal to 100. D) less than 0.
The equilibrium price of automobiles is a primarily macroeconomic issue
a. True b. False
Monopolistic competition in long-run equilibrium is characterized by
a. excess capacity. b. higher cost per unit of output than under perfect competition. c. inefficiency in use of resources. d. All of the above are correct.
Which of the following is an example of monetary policy?
a. Regulating financial capital markets b. Decreasing the tax rate c. Increasing the amount of government spending d. Regulating factors of production