The graph shown demonstrates a tax on sellers. Which of the following can be said about the effect of this tax?
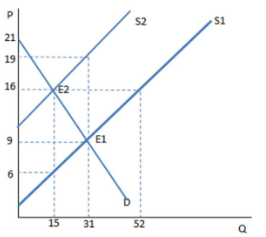
The graph shown demonstrates a tax on sellers. Which of the following can be said about the A. The tax creates a shortage, and rationing must occur.
B. The tax creates a surplus, and the government must buy the excess.
C. The tax creates a shortage, and the government must regulate the market.
D. None of these is true.
D. None of these is true.
You might also like to view...
Economists define risk as
A) the difference between the interest rate borrowers pay and the interest rate lenders receive. B) the chance that the value of financial assets will change from what you expect. C) the ease with which an asset can be exchanged for other assets or for goods and services. D) the difference between the return on common stock and the return on corporate bonds.
The consensus is that approximately ________ percent of U.S. households are subject to a liquidity constraint in consumption
A) 75 B) 55 C) 35 D) 15 E) 5
The Beveridge curve shifted outward during what period?
A) during the Great Depression. B) during the Great Moderation. C) after January 2008. D) between January 2000 and December 2007.
Starting from an equilibrium position,
a. the imposition of a price floor below the equilibrium price will increase the quantity demanded. b. the imposition of a price floor below the equilibrium price will decrease the quantity exchanged. c. the imposition of a price floor above the equilibrium price will decrease the quantity demanded. d. the imposition of a price floor above the equilibrium price will increase the quantity exchanged.