Use the line graph to answer the question.Beginning with 1996, Tom calculated his 18-hole average golf score each year. What was his average score for 18 holes in 1997?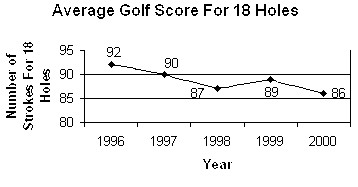
A. 87
B. 90
C. It is not possible to answer this question using the line graph.
D. 92
Answer: B
Mathematics
You might also like to view...
Graph the linear equation by finding and plotting its intercepts.6y = 4x - 14
A. 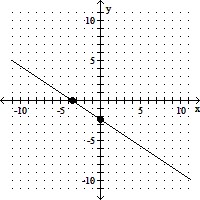
B. 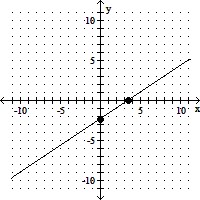
C. 
D. 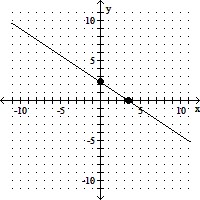
Mathematics
Divide.
A. x2 + 4
B. x + 4 + 
C. x - 4
D. x + 4
Mathematics
Graph.f(x) = 2x - 6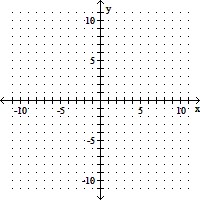
A. 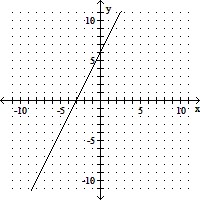
B. 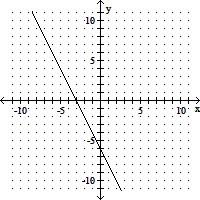
C. 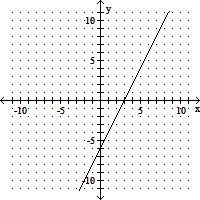
D. 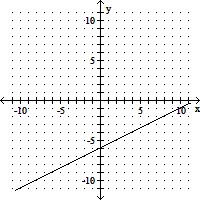
Mathematics
Provide the appropriate response.Suppose that the complete graph of a quadratic function shows that -3 and 7 are the only x-intercepts, and the behavior is described by f(x) ? -? as ?x? ? ?. Find the solution set of f(x) < 0.
A. (-?, -3) ? (7, ?) B. (-?, ?) C. ? D. (-3, 7)
Mathematics