The following data represent a personal income tax schedule. Answer the question on the basis of this information. Refer to the table below. The average tax rate at the $60,000 level of income is:
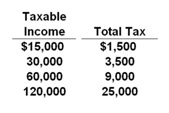
A. 10.0 percent
B. 11.6 percent
C. 15.0 percent
D. 20.8 percent
C. 15.0 percent
You might also like to view...
In the figure above, the economy is at an equilibrium with real GDP of $16 trillion and a price level of 110. As the economy moves toward its ultimate equilibrium, the ________ curve shifts ________
A) aggregate supply; leftward B) aggregate supply; rightward C) aggregate demand; rightward D) aggregate demand; leftward E) potential GDP; leftward
Which of the following Latin American countries had by far the worst growth rate between 1960 and 2011?
A) Brazil B) Columbia C) Mexico D) Venezuela
Each Federal Reserve Note bears a seal placed to the left of George Washington on the $1 bill that identifies the
a. discount rate b. legal reserve requirement c. federal funds rate d. value of M1 e. District Bank that issued it
A measure by which prices are expressed is a(n)
A. medium of exchange. B. unit of accounting. C. store of value. D. standard of deferred payment.