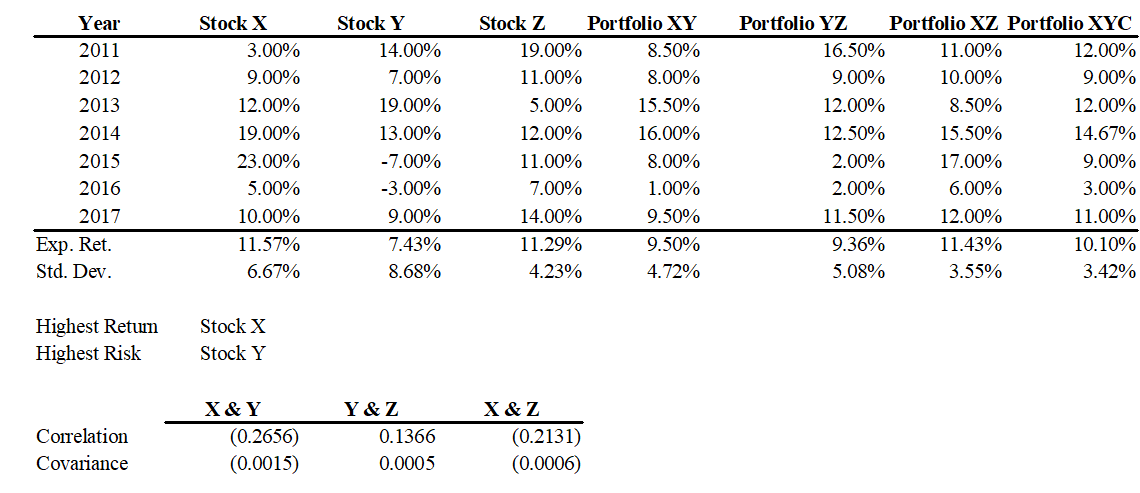
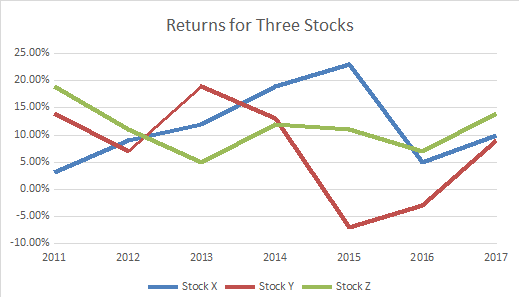
The annual returns of three stocks for the past seven years are given in the following table:

a) Determine the average return and the standard deviation of returns for each stock. Which stock has the highest expected return and which one has the highest risk?
b) Determine the correlation coefficient and the covariance between each pair of stocks.
c) Determine the average return and the standard deviation of returns of equally weighted portfolios consisting of two stocks (XY, YZ, and XZ) and three (XYZ) stocks. How do the returns and standard deviations of the portfolios compare to those of the individual stocks?
d) Create a chart that shows how the standard deviation of the two-stock portfolios changes as the weight of one of the stocks changes.
e) Use the Solver to determine the minimum standard deviation that could be obtained by combining each pair of two stocks, and also all three stocks into a single portfolio.


You might also like to view...
According to the text, graphical models are logical, preliminary steps to developing mathematical models
Indicate whether the statement is true or false
The balance sheet amount of shareholders' equity does not, and is not intended to, provide the user of the financial reports with a measure of the market value of common equity
Indicate whether the statement is true or false
The ________ approach involves mentioning the name of a person known to both the buyer and seller.
A. curiosity B. introductory C. question D. referral E. demonstration
Herzberg’s two-factor theory showed that ____ factors, such as salaries, work conditions and company policies, can lead to dissatisfaction when they are absent.
a. Motivators b. Maintenance c. Intrinsic d. Extrinsic