Solve the problem.A certain magazine reports that the percentage of trading days in which the stock market loses or gains 2% or more has been increasing over the last six years indicating more volatility in the stock market. Use a graphing utility to fit an exponential function to the data. Round the values to the nearest thousandth. Then, use the function to predict the percentage of trading days, to the nearest day, in the seventh year. 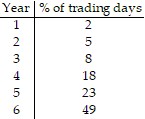
A. y = 2.354e0.611x, 92 days
B. y = 1.669x1.706, 46 days
C. y = 1.849e0.531x, 76 days
D. y = 1.278e0.611x, 92 days
Answer: D
You might also like to view...
Determine whether the statement is true or false.Greatest common factors can not be found by using prime factorization, only by using the division method.
A. True B. False
Factor the expression completely.3x2 - 24x + 48
A. (x - 4)(3x - 12) B. 3(x - 16)(x + 1) C. (3x - 12)(x - 4) D. 3(x - 4)(x - 4)
Identify the parts of each expression. Choose from these labels: variable, constant, and coefficient. g
g
A.  is a coefficient; g is a variable.
B.  is a coefficient; g is a constant.
C.  is a variable; g is a constant.
D.  is a variable; g is a variable.
Graph the function f by starting with the graph of y = x2 and using transformations (shifting, compressing, stretching, and/or reflection).f(x) =  x2 + 2
A. 
B. 
C. 
D. 