The following table shows the hourly wage W, in dollars, of a certain worker t years after 2000.
t0246 A $16.87 $18.96 $21.30 $23.93?
A: Make a table of successive ratios to show that the wage can be modeled by an exponential function. Round your answer to two decimal places.B: Find an exponential model for the data. Be careful. The data are presented in 2-year increments. Round your answer to two decimal places.C: Plot the graph of the data points along with the exponential model. Include up through 2010.D: According to the model, the worker got a pay raise each year. What percentage raise did the worker get each year? Round your answer to two decimal places.
What will be an ideal response?
A:
?
| Time increment | From  to to  | From  to to  | From  to to  |
| Ratios of W |  |  |  |
?
B: 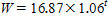
C: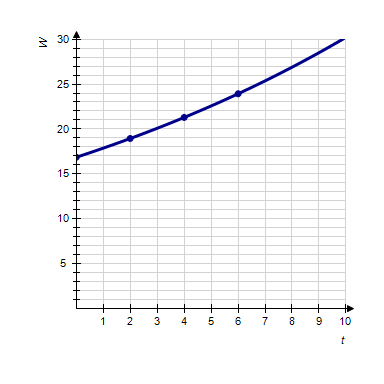
D: 6.00%
Mathematics
You might also like to view...
Complete the table and use it to solve the given equation. = 5
= 5
A. -26 B. No solution C. -15 D. -6
Mathematics
Graph the function.f(x) = 5(3x - 4)
A. 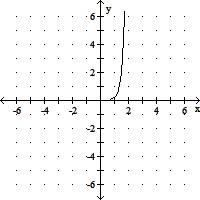
B. 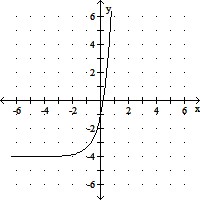
C. 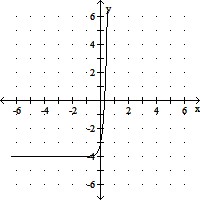
D. 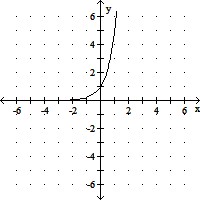
Mathematics
Find a point-slope form for the equation of the line satisfying the conditions.Slope -9, passing through (-5, -4)
A. y = -9(x - 5) + 4 B. y = 9(x - 5) + 4 C. y = -9(x + 5) - 4 D. y + 4 = 9x + 5
Mathematics
Solve the problem.The profit P for selling x items is given by the equation P(x) = 2x - 500. Express the sales amount x as a function of the profit P.
Fill in the blank(s) with the appropriate word(s).
Mathematics