Solve the problem.The bar graph below shows a company's yearly profits from 2003 to 2011. Let an represent the company's profit, in millions, in year n, where n = 1 corresponds to 2003, n = 2 corresponds to 2004, and so on. 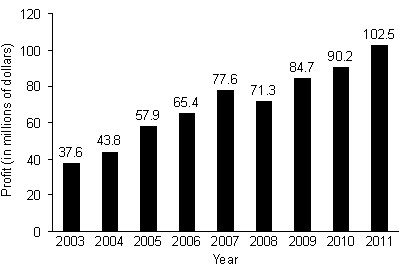 Find
Find 
A. $370.5 million
B. $108.9 million
C. $353.6 million
D. $316 million
Answer: C
You might also like to view...
Find the point(s) at which the given function equals its average value on the given interval.f(x) =  ; [0, 12]
A. 6
B. 5
C. 
D. 7
Solve the problem.Carla LaFong worked a 58 hr work week last week. She is paid  times her regular hourly rate for all hours over a 40 hr week. Her pay last week was $777.20$. What is her hourly rate?
A. $11.35 B. $12.90 C. $11.60 D. $11.70
Solve the problem.To the nearest dollar, the average tuition at a public four-year college was  the year Jane enrolled there and
  when her sister entered college 3 years later. Find the average yearly increase in tuition from the year Jane began college to when her sister began (to the nearest dollar per year).
A. tuition increased $68 per year B. tuition decreased $68 per year C. tuition increased $85 per year D. tuition increased $79 per year
Solve the equation for the indicated variable. Assume no denominator is 0.Ve =  mv2, for v
A. v = ± 
B. v = ±
C. v = 
D. v = ±2 