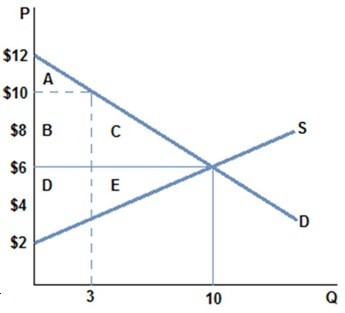
 According to the graph shown, if the market is in equilibrium, consumer surplus is area:
A. A + B + C.
B. A.
C. D + E.
D. A + B + C + D + E.
Answer: A
You might also like to view...
Refer to the figure below.________ inflation will eventually move the economy pictured in the diagram from short-run equilibrium at point ________ to long-run equilibrium at point ________, 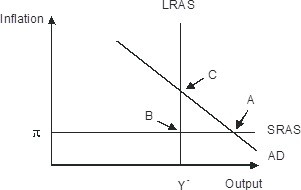
A. Rising; B; C B. Falling; A; C C. Falling; A; B D. Rising; A; C
In the above figure, the curve that represents the second most income equality is
A) a. B) b. C) c. D) d.
Marginal Revenue Product with six units of labor would be
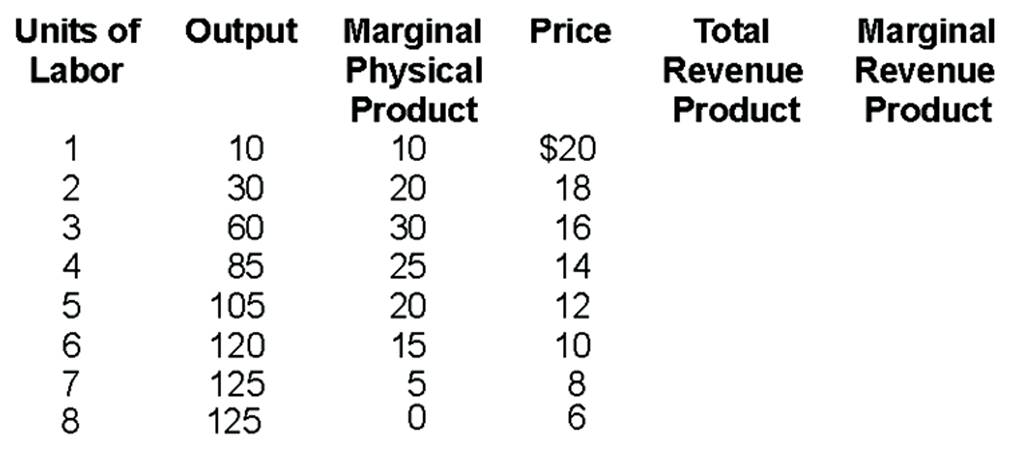
A. $70.
B. $60.
C. $120.
D. -$60.
Suppose that in 2012 ABC Corp. produced 500 million units of a good at an average cost of $2, and in 2013 ABC Corp. expanded its plant capacity and produced 600 million units at an average cost of $1.80. In this range, one can conclude that ABC Corp. is experiencing:
A. economies of scale. B. diseconomies of scale. C. neither economies of scale nor diseconomies of scale. D. diminishing marginal product.