Of the collection of supply and demand diagrams in Figure 2.2, which one shows the result of a decrease in technology in the market for anything?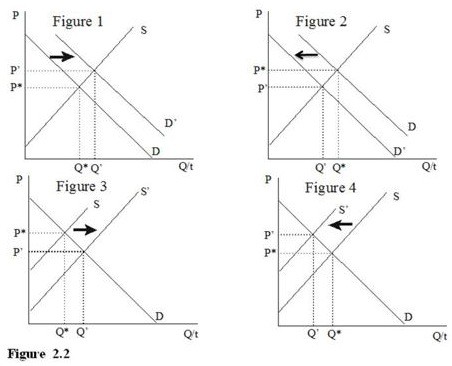
A. Figure 1
B. Figure 2
C. Figure 3
D. Figure 4
Answer: D
You might also like to view...
There are many cattle ranchers in the world, and there are also many McDonald's restaurants in the world. Why, then, does a McDonald's restaurant face a downward-sloping demand curve while a cattle rancher faces a horizontal demand curve?
What will be an ideal response?
A firm that successfully differentiates its product or lowers its average cost of production creates
A) a perfectly inelastic demand curve for its product. B) value for its customers. C) entry barriers into its market. D) economies of scale.
At a level of output equal to the economy's potential, the simple spending multiplier in the long run equals one
a. True b. False Indicate whether the statement is true or false
A tax on buyers decreases the quantity of the good sold in the market
a. True b. False Indicate whether the statement is true or false