The following chart shows some figures from an income statement. Prepare a vertical analysis by expressing each item as a percent of net sales. Round percents to the nearest tenth of a percent. 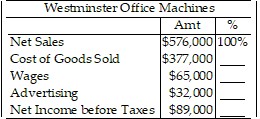
A. 65.5%, 11.3%, 49.2%, 15.5%
B. 65.5%, 11.3%, 5.6%, 15.5%
C. 65.5%, 11.5%, 8.5%, 23.6%
D. 65.5%, 17.2%, 8.5%, 23.6%
Answer: B
Mathematics
You might also like to view...
Solve the problem.Two cars leave an intersection. One car travels north; the other east. When the car traveling north had gone 9 mi, the distance between the cars was 3 mi more than the distance traveled by the car heading east. How far had the eastbound car traveled?
A. 18 mi B. 9 mi C. 15 mi D. 12 mi
Mathematics
Perform the indicated operation. Simplify if possible.-  -
- 
A. 
B. 
C. 
D. 
Mathematics
Find the vertices and graph the hyperbola. -
-  = 1
= 1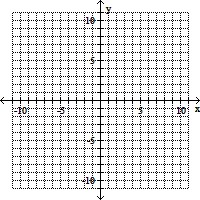
A. (0, -7), (0, 7)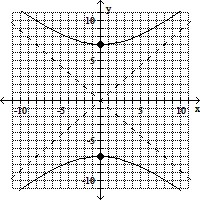
B. (0, -2 ), (0, 2
 )
)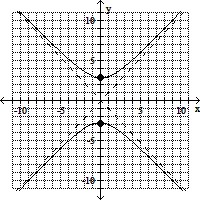
C. (-7, 0), (7, 0)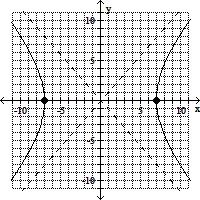
D. (0, -8), (0, 8)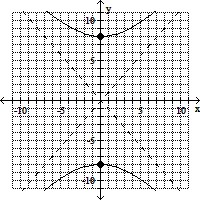
Mathematics
Find the slope of the line that goes through the given points.(-2, -26) and (4, 28)
A. - 
B. -9
C. 
D. 9
Mathematics