Solve the problem.Data regarding the amount spent by a government department is represented in the following graph. Find the change in amount spent for the years shown in the graph. Is the graph a straight line?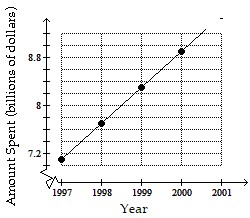
A. Change for each year: $0.6 billion; yes
B. Change for each year: $0.15 billion; yes
C. Change for each year: $0.35 billion; yes
D. Change from 1998 to 1999: $0.6 billion, change from 1999 to 2000: $0.15 billion; no
Answer: A
Mathematics
You might also like to view...
Solve the problem.Find the mode for the scores: 5, 9, 21, 3, 2, 8, 46, 1, 4, 16.
A. 9 B. no mode C. 10.9 D. 8
Mathematics
Find the values of x for which the geometric series converges.
A. 1 < x < 5 B. -1 < x < 7 C. 1 < x < 7 D. -5 < x < 5
Mathematics
Evaluate the expression for the given values. (a) y = 5(b) y = 8(c) y = -5
A. (a) 0
(b) 6
(c) - 
B. (a) undefined
(b) 6
(c) 
C. (a) 0
(b) 6
(c) 
D. (a) undefined
(b) 6
(c) - 
Mathematics
Find the slope of the line containing the pair of points.(-5, 5), (-1, 5)
A. 0 B. -4 C. 4 D. No slope
Mathematics