According to the following graphs, what does the curve in the lower graph show?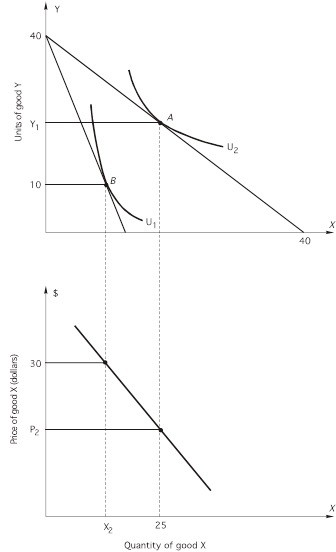 The price of Y is $15 per unit.
A. how a consumer's preferences change when income changes
B. how a consumer's utility-maximizing choices of X changes when the price of X changes
C. how a consumer's utility-maximizing choices of Y changes when the price of Y changes
D. how a consumer's utility-maximizing choices of X and Y change when the budget constraint changes
E. both c and d
Answer: B
You might also like to view...
There is a surplus in a market for a product when
A. demand is less than supply. B. quantity demanded is less than quantity supplied. C. the current price is lower than the equilibrium price. D. quantity demanded is greater than quantity supplied.
If the price of sandals is fixed by law below the market-clearing price,
A) a surplus of sandals will result. B) sandal inventories at shoe stores will be smaller. C) sandal sellers will spend more on advertising. D) the quantity of sandals demanded will be greater than the quantity supplied. E) the quantity of sandals demanded will be less than the quantity supplied.
In the long-run ISLM model and with everything else held constant, the long-run effect of an expansionary monetary policy is to
A) increase real output and the interest rate. B) not change either real output or the interest rate. C) increase real output and leave the interest rate unchanged. D) increase the interest rate and leave real output unchanged.
The sale of western land after 1790 was steady and strong
Indicate whether the statement is true or false