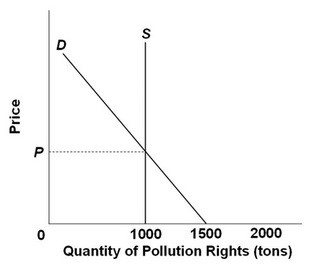
 Refer to the above diagram illustrating a market for pollution rights in which government has fixed the supply of rights at 1,000 tons. If the demand for pollution rights were to increase as a result of economic growth, the:
A. volume of pollutants discharged would increase.
B. supply curve would shift to the right.
C. price of pollution rights would increase.
D. demand curve would shift to the left.
Answer: C
You might also like to view...
The magnitude of the slope of the budget line
A) is defined as marginal rate of substitution. B) equals the relative price of the good measured along the horizontal axis. C) increases when income increases. D) decreases when income increases.
Transfer payments provide benefits to
a. all those in need b. those who have paid into governmental funds through their workplace c. those who are eligible recipients d. those who provide some service to the government e. anyone transferring from one stage of their life to another
Which of the following would not shift the demand for pounds curve to the right?
a. An increase in real U.S. GDP. b. A decrease in U.S. interest rates. c. A decrease in real U.S. GDP. d. An increased taste for British goods by Americans. e. None of the above.
Refer to the graph below. If the output level is Q1, then there are efficiency losses indicated by the area:
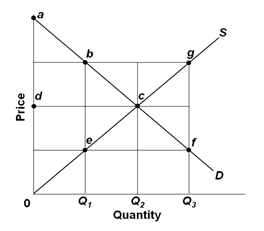
A. 0abe
B. bce
C. 0eQ1
D. ecf