Refer to the graph shown. The shift in the graph from D1 to D2 is least likely to be caused by: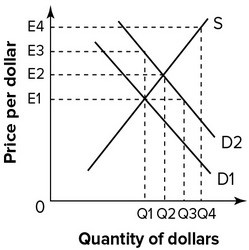
A. expansionary fiscal policy that raises U.S. income.
B. contractionary fiscal policy that increases U.S. exports.
C. contractionary fiscal policy that reduces U.S. prices.
D. expansionary fiscal policy that raises U.S. interest rates.
Answer: A
You might also like to view...
Most consumers in stores use marginal analysis to make their buying decisions.
Answer the following statement true (T) or false (F)
If a country's international reserves are decreasing, then its exchange rate is ________ and there is a balance-of-payments ________.
A. undervalued; surplus B. undervalued; deficit C. overvalued; surplus D. overvalued; deficit
When the number of Alaskan fishermen increased, salmon prices fell to record lows. This could be shown graphically by a shift in the:
A. supply curve right. B. demand curve left. C. supply curve left. D. demand curve right.
Refer to the graph below, which shows the market for bicycles. S1 and D1 are the original supply and demand curves. D2 and D3 and S2 and S3 are possible new demand and supply curves. Starting from the initial equilibrium (point 1), which point on the
graph is most likely to be the new equilibrium after an increase in wages of bicycle workers, and a significant increase in the price of gasoline?
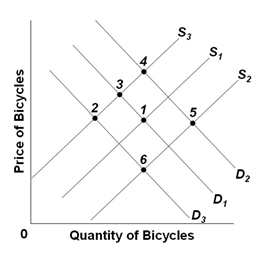
A. 6
B. 3
C. 4
D. 5