A time-series graph measures
A) the value of one variable against the value of another variable.
B) the value of an economic variable for different groups in a population at a point in time.
C) time on the x-axis and the variable or variables in which we are interested on the y-axis.
D) time on both the x-axis and y-axis and the variable or variables in which we are interested in the rest of the figure.
E) time on the y-axis and the variable or variables in which we are interested on the x-axis.
C
You might also like to view...
The incentive for analysts in investment banks to distort research increases when
A) revenues from brokerage commissions increase. B) the potential revenues from underwriting greatly exceed brokerage commissions. C) the potential brokerage commissions greatly exceed revenues from underwriting. D) revenues from underwriting decrease.
If the price of automobiles was to increase, then
A) the demand for gasoline would decrease. B) the demand for gasoline would increase. C) the supply of gasoline would increase. D) the quantity of gasoline demanded would decrease.
Refer to the information provided in Figure 2.5 below to answer the question(s) that follow.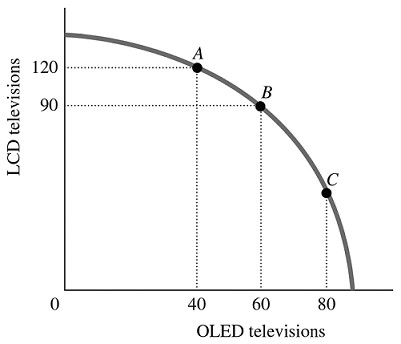 Figure 2.5Refer to Figure 2.5. For this economy to move from Point B to Point C so that an additional 20 OLED televisions could be produced, production of LCD televisions would have to be reduced by
A. more than 30. B. exactly 60. C. fewer than 30. D. exactly 30.
The equation {1/[1 - (MPC - MPM)]} represents the
A. money multiplier. B. open economy multiplier. C. closed economy multiplier. D. government spending multiplier.