The following double-bar graph illustrates the revenue for a company for the four quarters of the year for two different years. Use the graph to answer the question.  How much did the revenue decrease in 2010 from the first quarter to the second quarter?
A. $5,000,000
B. $10,000,000
C. $20,000,000
D. $15,000,000
Answer: D
Mathematics
You might also like to view...
Solve the system by graphing. 3x + 2y = 5-6x - 4y = 5
A. No solution B. (-1.5, -1) C. (1, 1) D. (1.5, -1)
Mathematics
Use the given conditions to write an equation for the line in slope-intercept form.Slope = 2, passing through (-6, 4)
A. y - 4 = x + 6 B. y = 2x + 16 C. y - 4 = 2x + 6 D. y = 2x - 16
Mathematics
Give a formula for a piecewise-defined function f for the graph shown.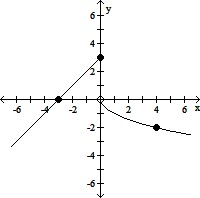
A.
f(x) = 
B.
f(x) = 
C.
f(x) = 
D.
f(x) = 
Mathematics
Solve the problem.An auditorium has 30 rows with 10 seats in the first row, 12 in the second row, 14 in the third row, and so forth. How many seats are in the auditorium?
A. 1230 B. 735 C. 1170 D. 600
Mathematics