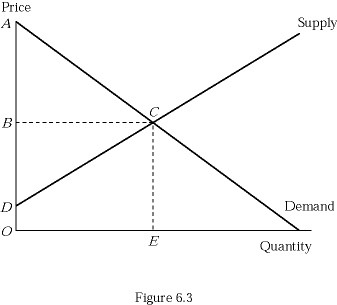
 Refer to Figure 6.3. On this graph, area BCEO represents:
A. producer surplus.
B. total surplus.
C. firm profits.
D. total revenues.
Answer: D
You might also like to view...
Refer to Figure 17-8. A typical long-run Phillips curve would have the appearance of a curve running through points
A) B and C. B) A and B. C) A and C. D) A, B, and C.
Assume that you assign the following subjective probabilities for your final grade in your econometrics course (the standard GPA scale of 4 = A to 0 = F applies): Grade Probability A 0.20 B 0.50 C 0.20 D 0.08 F 0.02 The expected value is:
A) 3.0 B) 3.5 C) 2.78 D) 3.25
Assume that initially country A exchanges three barrels of oil for one ton of steel from country B. Later the arrangement changes to four barrels of oil for one ton of steel. This indicates that:
a. the terms of trade for country B have improved. b. country A has a comparative advantage in the production of steel. c. the relative price of steel in terms of oil has fallen. d. the terms of trade for country A have improved. e. country B has an absolute advantage in the production of oil.
The primary objective of economics is
A) to learn how to create more resources. B) to study how people make choices with limited resources. C) to learn how to make the most profits with a given amount of resources. D) to study why some people are never happy with the resources they have.