Use the above figure. Graph ________ correctly depicts the short-run Phillips Curve
A) A B) B C) C D) D
D
You might also like to view...
The demand curve facing a perfectly competitive firm is
a. perfectly elastic b. perfectly inelastic c. unit elastic d. downward-sloping e. identical to the industry demand curve
Spending VCU4 on real-world goods and services causes the nation's:
a. Monetary base to rise. b. M2 money supply to rise. c. M2 money multiplier to remain the same. d. M2 money multiplier to fall.
Which of the following shifts short-run aggregate supply right?
a. an increase in the minimum wage b. an increase in immigration from abroad c. an increase in the price of oil d. an increase in the actual price level
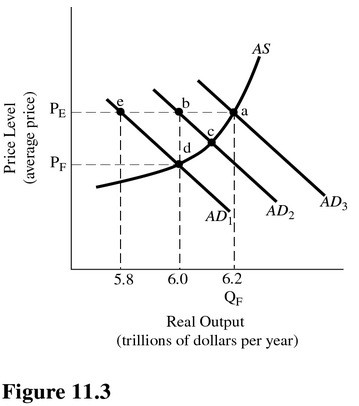 Refer to Figure 11.3. Assume aggregate demand is represented by AD2 and full-employment output is $5.8 trillion. If aggregate demand decreases by the amount of the AD Excess, equilibrium will occur at
A. Point a. B. Point b. C. Point c. D. Point d.