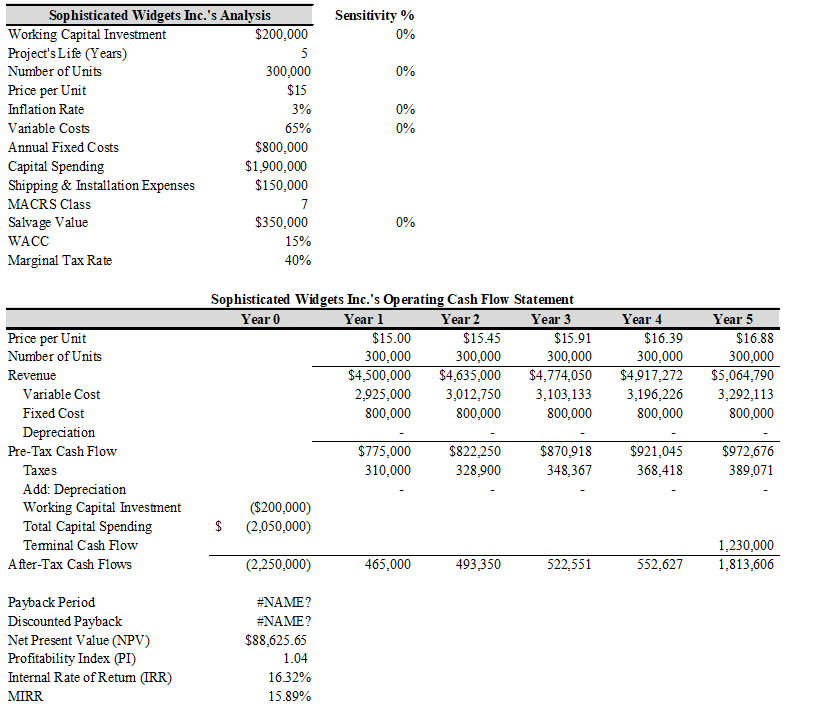
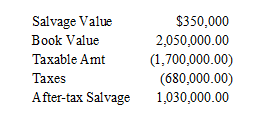
Sophisticated Widgets Inc. is considering an investment project that will require an initial investment of $200,000 in net working capital and have an estimated life of 5 years. The project’s incremental sales are expected to be 300,000 units at a price of $15 per unit for the first year. The price per unit is expected to grow at the rate of inflation of 3% per year. The variable costs will represent 65% of annual revenues and the fixed costs will be $800,000 annually. The capital spending associated with the project will cost $1,900,000 and will require an additional $150,000 of shipping and installation expenses. The fixed assets associated with the project will be depreciated using the MACRS 7-year class life. After five years the project’s fixed assets can be sold for $350,000.
The WACC is 15% and the marginal tax rate is 40%.
a) Calculate the initial investment, annual after-tax cash flows, and the terminal cash flow of this investment project.
b) Determine the payback period, discounted payback period, NPV, PI, IRR, and MIRR of this project. Should this project be accepted?
c) Perform the same sensitivity analysis as that in Exhibit 13-5, page 402 (except that you should use increments of 5% from -15% to 15%) for the following uncertain variables: number of units, variable cost as a percentage of sales, investment in net working capital, salvage value, and inflation rate. Create a sensitivity diagram that includes all of these variables.
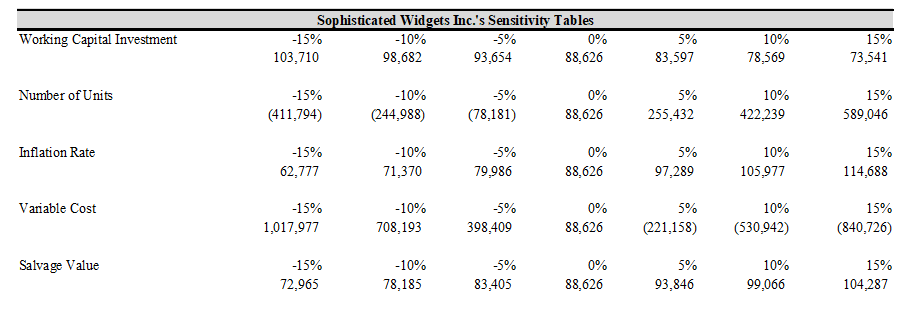
Note: A common problem with data tables is that they may not update. If that happens, the most likely cause is that somebody has set the worksheet calculation method to "Automatic except for data tables." Change that back to Automatic or press F9 to recalculate the tables.

Note: A useful technique, if you want to focus on only a few of the data series in the chart, is to select the chart and then click the funnel icon. That will allow you to turn individual series on or off.
While in that menu, you can also just hover the mouse cursor over an individual series. That will highlight that series in the chart, which allows you to see it more clearly.
You might also like to view...
The impairment test for an intangible asset with a definite life compares the
a. fair value of the asset to its book value. b. sum of the undiscounted cash flows expected to be generated by the asset to its book value. c. sum of the discounted cash flows expected to be generated by the asset to its fair value. d. sum of the undiscounted cash flows expected to be generated by the asset to its fair value.
Teens aged 14 or 15 may work ______ school hours for no more than 3 hours on a school day, 18 hours in a school week, 8 hours on a nonschool day, and 40 hours in a nonschool week.
A. outside B. inside C. during D. any
In the distribution of income, the net income is less than the salary and interest allowances granted, the remaining balance will be a negative amount that must be divided among the partners as though it were a loss
Indicate whether the statement is true or false
The marketing manager for Brand A Razors, a strong national brand, believes he knows how customers will react to a new product offering, but he conducts market research so that he can provide justification for this new product. This cannot be considered quality market research because it ________.
A. is not impartial and objective B. fails to prejudge the outcome C. is a result of the methodical analysis of data D. enhances the validity of the information E. enhances good decision making