Construct a bar graph to represent the given data.The following table shows the number of inches of rainfall measured at City X during the following days.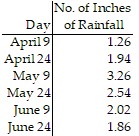
What will be an ideal response?
Answers may vary. The following is a possible answer.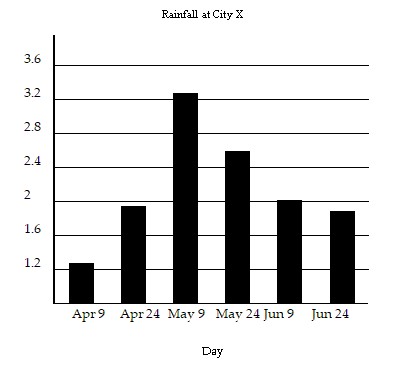
You might also like to view...
Use the graph of a known basic function and a combination of horizontal shifts, reflections, and vertical shifts to sketch the function.f(x) = -x2 + 2
A. 
B. 
C. 
D. 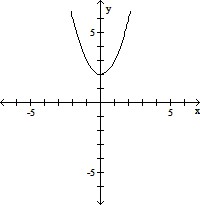
Find fractional notation for the ratio. You need not simplify.At an advertising agency that employs 282 people, 79 employees receive 3 weeks of paid vacation each year. Find the ratio of those who receive 3 weeks of paid vacation to those whose paid vacation is not 3 weeks.
A. 
B. 
C. 
D. 
Rationalize the denominator. Assume that all variables represent non-negative real numbers. Make sure you simplify the final answer.
A. 
B.  -
- 
C. 
D. 
Give the converse of “If it is a banana, then it is yellow.”
What will be an ideal response?