The graph below shows the approximate annual percentage growth rate in world population for the years 1960 through 2010. Data is estimated by the UN Census Bureau.Annual Growth Rate (Percentage) 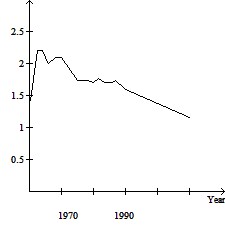 Use the graph to answer the question.In which year(s) during the period 1960-2010 is world population growing at the fastest rate?
A. 1963-1964
B. 1984
C. 1970
D. 2010
Answer: A
You might also like to view...
Solve the equation.8w2 - 3w + 1 = 0
A. 
B. 
C. 
D. 
Write the ratio in simplest form.50 years to 30 years
A. 
B. 
C. 
D. 
An inlet pipe on a swimming pool can be used to fill the pool in 35 hours. The drain pipe can be used to empty the pool in 40 hours. If the pool is half filled and then the drain pipe is accidentally opened, how long will it take to fill the pool? ? __________ hours
Fill in the blank(s) with the appropriate word(s).
Solve the problem.A ball is thrown downward with an initial velocity of 14 meters per second from a cliff that is  high. The height of the ball is given by the quadratic equation
 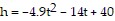 where h is in meters and t is the time in seconds since the ball was thrown. Find the time it takes the ball to hit the ground. Round your answer to the nearest tenth of a second.
A. 1.7 seconds B. 1.9 seconds C. 1.8 seconds D. 2.8 seconds