Find the volume of the solid generated by revolving the region bounded by the graphs of the equations about the x-axis. Verify your results using the integration capabilities of a graphing utility.
?
 ,
,  ,
,  ,
, 
?
A.  ?
?
B.  ?
?
C.  ?
?
D.  ?
?
E.  ?
?
Answer: C
You might also like to view...
Use a graphing utility to graph the polar equation.r = 

A. 
B. 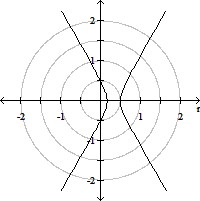
C. 
D. 
Find the area of the AAS or ASA triangle ABC. Round your answer to the nearest tenth when necessary.b = 16.0 ft, A = 24°30', C = 110°40'
A. 140.8 sq ft B. 65.4 sq ft C. 145.8 sq ft D. 70.4 sq ft
Conduct a survey to determine the major worry of school teachers.
What will be an ideal response?
In a study of the incidence of rickets in Tibetan children, a total of 1,556 urban and nonurban children were examined. Of these 1,019 had rickets. Of the 235 urban children in the study, 90 had rickets. Use Venn diagrams to determine how many children in nonurban areas had rickets, and how many children in nonurban areas did not have rickets. ?
A. 1,019 children in nonurban areas had rickets, and 537 in nonurban areas did not have rickets. B. 90 children in nonurban areas had rickets, and 145 in nonurban areas did not have rickets. C. 145 children in nonurban areas had rickets, and 392 in nonurban areas did not have rickets. D. 929 children in nonurban areas had rickets, and 392 in nonurban areas did not have rickets. E. 392 children in nonurban areas had rickets, and 929 in nonurban areas did not have rickets.