Table 11-2
QTRTC89590910293 10110100 11112105 12115110 ?
In Table 11-2, MC of the last unit produced at the profit-maximizing output is
A. $5.
B. $7.
C. $8.
D. $10.
Answer: B
You might also like to view...
The table below shows a pizzeria's fixed cost and variable cost at different levels of output. Pizza's sell for $20 each.Number ofPizzas Per DayFixed Cost($/Day)Variable Cost($/Day)050002550015050500250755004501005008501255001,650When the pizzeria makes 100 pizzas per day, it earns an economic ________ of ________.
A. profit, $650 B. loss, $500 C. profit, $1,150 D. loss, $650
In 1976, the cost of a movie was $4. In 2012, it's $9. If the CPI for 1976 is 56, and 228 for 2012, then we could say the cost of a 1976 movie in 2012 would be:
A. $16.29, so the cost of movies has not increased as much as general inflation. B. $16.29, so the cost of movies is relatively more in 2012 than it was in 1976. C. $2.21, so the cost of movies has not increased as much as general inflation. D. $2.21, so the cost of movies is relatively more in 2012 than it was in 1976.
This curve is
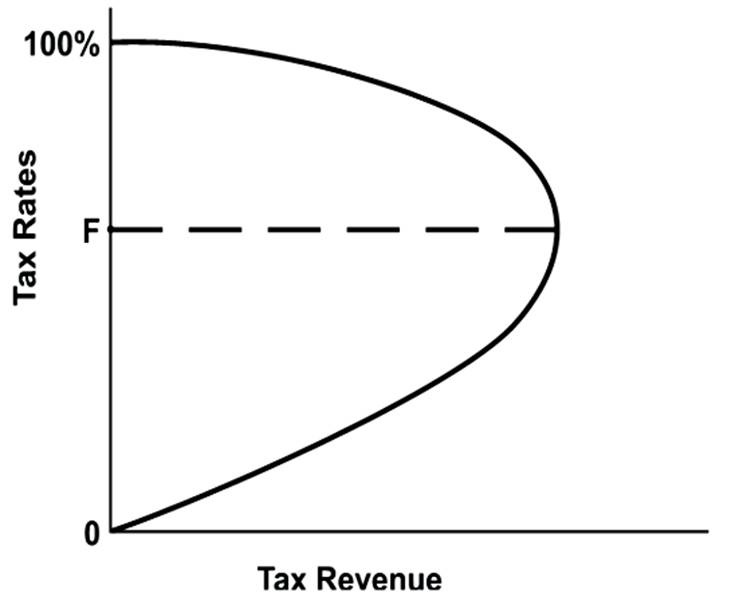
A. a Phillips curve.
B. a Laffer curve.
C. an aggregate supply curve.
D. an aggregate demand curve.
Which of the following would cause an economy to be producing at a point inside its production possibilities curve? A) the efficient allocation of all factors of production B) population growth C) unemployment and an inefficient use of available resources D) capital accumulation