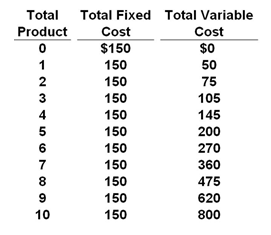
Refer to the cost table below. Based on the cost data given, which of the following price-quantity tables correctly represents the firm's short-run supply schedule?
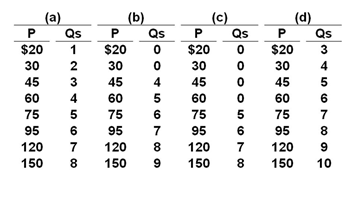
A. Table a
B. Table b
C. Table c
D. Table d
B. Table b
You might also like to view...
If the area between the line of equality and the Lorenz curve is 1,000, the Gini ratio is
A) 0.8. B) 0.2. C) 0.1. D) 0.5.
The income-consumption curve
A) illustrates the combinations of incomes needed with various levels of consumption of a good. B) is another name for income-demand curve. C) illustrates the utility-maximizing combinations of goods associated with every income level. D) shows the utility-maximizing quantity of some good (on the horizontal axis) as a function of income (on the vertical axis).
If the MPC is 0.6, and the government spends an additional $50b, the overall effect on GDP will be:
A. an increase of $250b. B. a decrease of $25b. C. a decrease of $75b. D. an increase of $125b.
Adverse selection in health insurance occurs when those who are less likely to need health care, such as younger and healthier workers, choose not to purchase it.
Answer the following statement true (T) or false (F)