Exhibit 3-3 Demand curves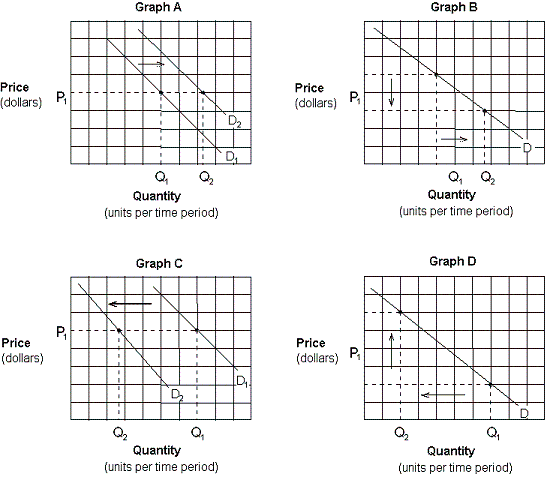
Which of the graphs in Exhibit 3-3 depicts the effect of a decrease in the price of pizza on the demand curve for pizza?
A. Graph A.
B. Graph B
C. Graph C.
D. Graph D.
Answer: B
You might also like to view...
In the figure above, what is the equilibrium price and quantity?
What will be an ideal response?
An increase in the equilibrium quantity of good X can be caused by
A) an increase the price of inputs utilized in producing good X. B) an increase in the price of good X. C) a technological improvement in the process of producing good X. D) a reduction in the number of producers of good X.
The smaller the reserve ratio the:
A. less a bank can loan out. B. smaller is the money multiplier. C. less money is created in the economy. D. greater the money is created in the economy.
Below the equilibrium level of nominal interest rates, there is a _______ of money and money interest rates will tend to _____ as a result. a. Shortage; fall. b. Shortage; rise. c. Surplus, fall
d. Surplus; rise.