Plot and interpret the appropriate scatter diagram.The one-day temperatures for 12 world cities along with their latitudes are shown in the table below. Make a scatter diagram for the data. Describe what happens to the one-day temperatures as the latitude increases. Latitude (degrees)
 Temperature (F)°
What will be an ideal response?
Latitude (degrees)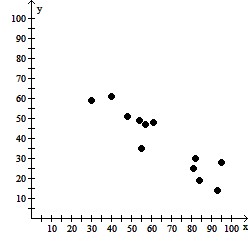
Temperature (F)°
As the latitude increases, the one-day temperatures decrease.
Mathematics
You might also like to view...
Find the derivative of y with respect to the independent variable.y = 7cos ??
A. 7cos ?? B. -7cos ?? ln 7 sin ?? C. -?7cos ?? ln 7 sin ?? D. ?7cos ?? ln 7
Mathematics
Find the directional derivative of f(x,y) = figure.png) - y³ at the point (1, 3) in the direction toward the point (3, 1).
- y³ at the point (1, 3) in the direction toward the point (3, 1).
 multiple choice.png)
Mathematics
Simplify.73 ÷ 0
A. 3 B. 1 C. 0 D. undefined
Mathematics
Solve and graph the solution set.12y - 1 ? 11y + 10![]()
A. {y|y > 12} or (12, ?)![]()
B. {y|y < 12} or (-?, 12)![]()
C. {y|y ? 11} or (-?, 11]![]()
D. {y|y ? 11} or [11, ?)![]()
Mathematics