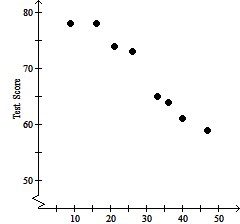
Plot and interpret the appropriate scatter diagram.The table shows the study times and test scores for a number of students. Draw a scatter plot of score versus time treating time as the independent variable.  Effect of Study on Test Score
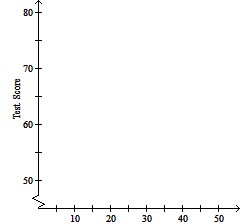 Time (min)
A. Effect of Study on Test Score
| Time (min) |
test scores.
B. Effect of Study on Test Score

| Time (min) |
test scores.
C. Effect of Study on Test Score
| Time (min) |
test scores.
D. Effect of Study on Test Score

| Time (min) |
test scores.
Answer: A
Mathematics
You might also like to view...
Factor a negative number or a GCF with a negative coefficient from the polynomial.-7x4 + x6
A. -7x4(1 - x2) B. -x4(7 + x2) C. -7x4(1 + x2) D. -x4(7 - x2)
Mathematics
Express the given vector as a linear combination of the unit vectors i and j.
A. 5i + 5j B. 3i + j C. -5i + 5j D. i + 3j
Mathematics
Use radical notation to rewrite.(a3/4 - b7/2)1/5
A.  -
- 
B. 
C. 
D. 4 -
- 
Mathematics
Find the complete quotient when P(x) is divided by the binomial following it. P(x) = x3 - 1; x - 1
A. x2 + x + 1 + 
B. x3 + x2 + x + 1
C. x2 + x + 1
D. x3 + x2 + x + 1 + 
Mathematics