The following line graph represents data pertaining to water flows over a dam. Use the graph to answer the following question(s).
 Which months saw flows of 200 kAF and 450 kAF, respectively?
A. February and October
B. November and April
C. November and February
D. March and October
Answer: C
Mathematics
You might also like to view...
Solve the equation in the interval [0, 2?). img src="https://sciemce.com/media/4/19ea663401d44342(1) figure 1.png" class="w-image" />
What will be an ideal response?
Mathematics
Solve the problem.A rotation has sent A to A' and E to E'. Find the image of the given figure.
A. 
B. 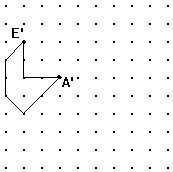
C. 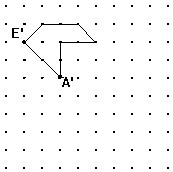
D. 
Mathematics
Factor and simplify the algebraic expression.(x + 7)-1/5 + (x + 7)-6/5
A. 
B. (x + 7)-1/5 + (x + 7)-6/5
C. 
D. (x + 7)6/5(x + 8)
Mathematics
Answer the question.Use two different methods to simplify the fraction. Explain each step of your work.
What will be an ideal response?
Mathematics