Refer to the graph shown. Assume the market is initially in equilibrium at point b in the graph but the imposition of a per-unit tax on this product shifts the supply curve up from S0 to S1. The lost consumer surplus of this tax is equal to the area: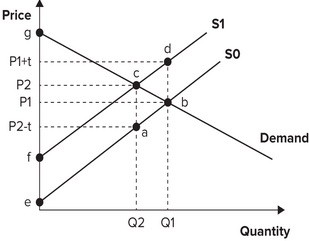
A. cdb.
B. cab.
C. P2P1bc.
D. P1(P2 ? t)ab.
Answer: C
You might also like to view...
In Figure 4-6 above, with IS0 shifting to IS1 against the upward-sloping LM curve, crowding-out is the result that
A) income stays at YO3. B) income rises to Y1 instead of to Y2. C) income rises to Y1 instead of staying at YO3. D) income rises to Y2 instead of to Y1.
Banks have a maturity mismatch since
A) they borrow long term, but lend short term. B) they borrow short term, but lend long term. C) some of their loans are short term while others are long term. D) some of their borrowings are short term while others are long term.
Doomsday forecasts about running out of natural resources, with dire consequences,
a. have occurred at least as far back in time as the 16th century. b. have generally been correct, and resources today are nearly all rising in price. c. seldom are taken seriously enough by the public. d. began to be heard for the first time after Earth Day of 1970.
Answer the following questions true (T) or false (F)
1. The substitution effect explains why there is a direct relationship between the price of a product and the quantity of the product demanded. 2. If consumers believe the price of LCD televisions will decrease in the future, this will cause the demand for LCD televisions to increase now. 3. An increase in population results in an increase in demand.