The following comparison line graph indicates the number of vehicles sold for a seven week period by two different salespeople. Use the graph to answer the question.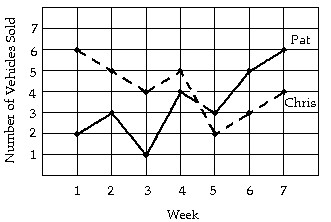 During what week did Chris sell the most number of vehicles?
A. Week 5
B. Week 3
C. Week 7
D. Week 1
Answer: D
Mathematics
You might also like to view...
Find the coefficient and degree of the monomial.-18xy
A. coefficient: 2, degree: -18 B. coefficient: 18, degree: 1 C. coefficient: -18, degree: 1 D. coefficient: -18, degree: 2
Mathematics
Provide an appropriate response.Simplify: 
What will be an ideal response?
Mathematics
Solve the problem.The string on a balloon is 56 mm long. What is this length measured in cm?
A. 560 cm B. 5600 cm C. 5.6 cm D. 0.6 cm
Mathematics
Solve the problem.A certain radioactive isotope decays at a rate of 0.175% annually. Determine the half-life of this isotope, to the nearest year.
A. 396 yr B. 172 yr C. 4 yr D. 286 yr
Mathematics