The figure below shows a shift in the production-possibility curve of a country from AB to AC. Here, S1 and C1 are the initial production and consumption points, respectively. S2 and C2 are the final production and consumption points, respectively. Which of the following is illustrated by this figure?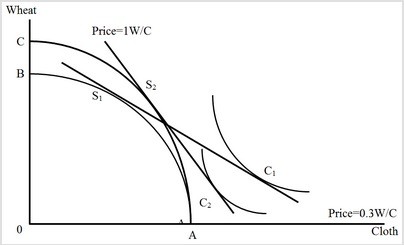
A. A small country experiencing a balanced growth
B. A large country experiencing growth biased toward wheat production
C. A large country experiencing a balanced growth
D. A small country experiencing growth biased toward cloth production
Answer: B
You might also like to view...
Suppose the reserve ratio is RR. Then,
A) required reserves = RR × excess reserves. B) required reserves = RR × loans. C) required reserves = RR × deposits. D) required reserves = RR × actual reserves.
The underground economy
A. consists mainly of such involuntary transfer payments as savings and loan fraud and bank robberies. B. consists only of illegal activities such as prostitution, loan-sharking, and narcotics. C. is a very stable percentage of GDP. D. causes GDP to be underestimated by 10 to 15 percent.
Bambi sells apples that she produces up to the equilibrium price of $20 per bushel. Andre sells green beans that he produces up to the equilibrium price of $18 per bushel. If they both sell the same number of bushels, but Andre makes more profit than Bambi, which of the following situations is true?
a. Producer surplus is greater for green beans than apples. b. Producer surplus is less for green beans than apples. c. Producer surplus is the same for green beans and apples. d. Producer surplus is negative for both green beans and apples.
The strategy for the Stackelberg Leader is
A. to take account of the effect of its own behavior on the rival firm's quantity choice. B. collusion. C. to sell a marginally higher quantity of goods than the rival. D. to sell at a marginally lower price than the rival.