Provide an appropriate response.The table shows the number of pupils per teacher in selected counties in a certain state. 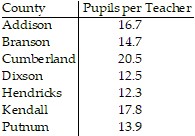 For which counties are the values not less than 12.5?
A. Addison, Branson, Cumberland, Kendall, Putnum
B. Hendricks
C. Addison, Branson, Cumberland, Dixson, Kendall, Putnum
D. Dixson, Hendricks
Answer: C
Mathematics
You might also like to view...
Match the equation with the surface it defines. +
+  =
= 
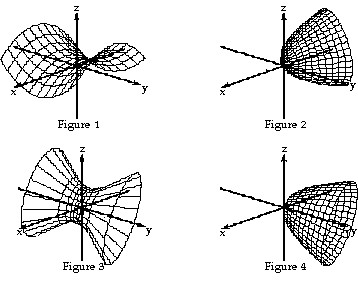
A. Figure 3 B. Figure 1 C. Figure 2 D. Figure 4
Mathematics
Use L'H pital's rule to find the limit.

A. 0 B. -1 C. ? D. 1
Mathematics
Determine whether the graph has a Hamilton circuit.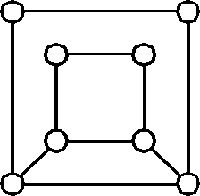
A. No B. Yes
Mathematics
Provide an appropriate response.Find the standard deviation for the scores: 76 59 97 96 88
A. 15.9 B. 7.96 C. 83.2 D. 14.25
Mathematics