Use a graphing calculator to plot the data and find the quadratic function of best fit.An engineer collects data showing the speed s of a given car model and its average miles per gallon M. Use a graphing calculator to plot the scatter diagram. What is the quadratic function of best fit?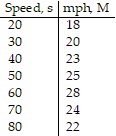
A. M(s) = 0.063x2 + 0.720x + 5.142
B. M(s) = -0.631x2 + 0.720x + 5.142
C. M(s) = -6.309x2 + 0.720x + 5.142
D. M(s) = -0.0063x2 + 0.720x + 5.142
Answer: D
Mathematics
You might also like to view...
List all the natural number factors of the number.196
A. 1, 2, 4, 7, 14, 28, 49, 98, 196 B. 1, 2, 3, 4, 7, 14, 49, 98, 196 C. 1, 2, 4, 7, 14, 21, 28, 49, 98, 196 D. 1, 2, 7, 49, 196
Mathematics
Provide an appropriate response.To factor the polynomial ax2 + bx + c by grouping, you first find two numbers, m and n, such that  and
and 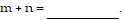
A. c; b B. b; ac C. ac; b D. bc; a
Mathematics
Graph the system of inequalities.y ? x2x + y > 6
A. 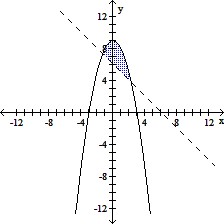
B. 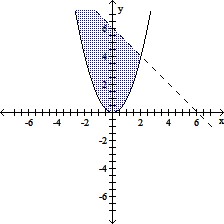
C. 
D. 
Mathematics
Reduce the rational expression to lowest terms.
A. 
B. 
C. 
D. 
Mathematics