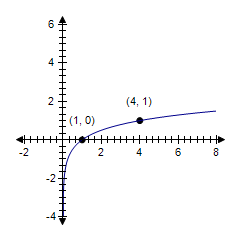
Find the value of b, if any, that would cause the graph of  to look like the graph shown.
?
?
A. b = 3.5
B. b = 4.5
C. b = 2
D. b = 4
E. b = 1
Answer: D
You might also like to view...
Plot the ordered pair in the coordinate plane. In which quadrant or on which axis does the point lie?(4, 0)
A. Quadrant III
B. x-axis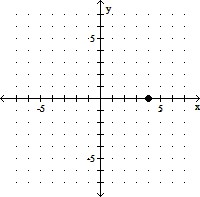
C. x-axis
D. y-axis
Solve the system.x + y + z = 6 x - z = -2 y + 3z = 11
A. {(-1, 2, -3)} B. {(1, 2, 3)} C. {(0, 1, 2)} D. ?
A company installs 5,000 light bulbs. The lifetimes of the lightbulbs are approximately normally distributed with a mean of 500 hours and a standard deviation of 100 hours. Find the approximate number of bulbs that can be expected to last the indicated amount of time.Between 540 hours and 780 hours
A. 2,215 B. 1,717 C. 2,217 D. 1,710
Solve the problem. Express answers as a percent rounded to the nearest tenth. The Garden Shop had a cost of goods sold of $108,000, operating expenses of $40,000, and net sales of $210,000. Find the cost of goods sold percent of net sales and operating expenses percent of net sales.
A. cost of goods sold percent of net sales: 51.4%, operating expenses percent of net sales: 19.0% B. cost of goods sold percent of net sales: 51.4%, operating expenses percent of net sales: 32.4% C. cost of goods sold percent of net sales: 32.4%, operating expenses percent of net sales: 51.4% D. cost of goods sold percent of net sales: 19.0%, operating expenses percent of net sales: 51.4%